Biomarker Searching | Analysis of Changed Protein Components by LCMS-IT-TOF and Analysis Software
Biomarker Searching
Analysis of Changed Protein Components by LCMS-IT-TOF and Analysis Software
Protein expression in an organism is known to exhibit specific changes due to cancer or other diseases.
A variety of methods is available for detecting such quantitative and qualitative changes in proteins.
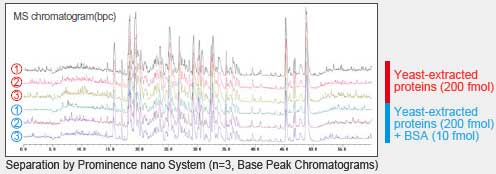
One of these methods involves the separation of peptide components by nanoflow LC and the analysis and identification of changed components by a combination of LCMS-IT-TOF mass spectrometry and statistical analysis software. This method is introduced below.

Analysis Results for Yeast-Extracted Proteins With and Without BSA Spiking

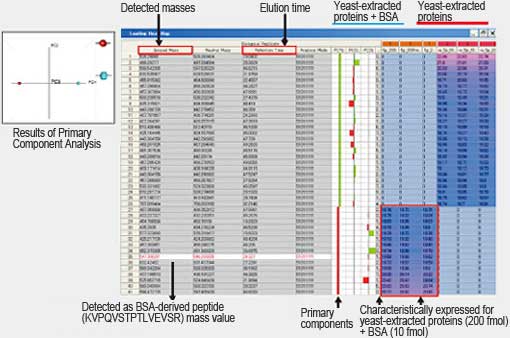
Principle component analysis of yeast-extracted proteins with and without BSA spiking achieved clear separation of components along the primary component (PC1) axis. These were detected as peptides derived from the spiked BSA.
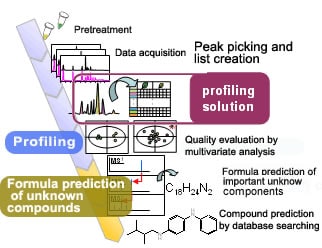
Multivariate analysis, such as primary component analysis, allows selection of just the significantly changed components by software.
This method permits the efficient detection and identification of only those components exhibiting changes, without labeling with stable isotopes or comprehensively identifying all components.
LCMS-IT-TOF Liquid Chromatograph Mass Spectrometer
Conventional 2D electrophoresis requires complex manual operations and is difficult to automate. However, a system comprising a combination of a Prominence nano nanoflow LC and LCMS-IT-TOF liquid chromatograph mass spectrometer achieves high reproducibility for separation analysis. It incorporates Nano-Assist dedicated control software to simplify setup of analytical conditions and provide automation. In addition, the dedicated nano-ESI interface permits highly sensitive protein analysis. This system is suited to the analysis of highly hydrophobic or basic proteins and proteins with a wide range of molecular mass that are difficult to separate by electrophoresis.
Metabolomics Analysis Software

ProfilerTM AM+ metabolomics analysis software performs statistical analysis of the huge amount of data obtained by a mass spectrometer. It compares and statistically overlays two or more sample sets to identify the metabolites that have the greatest effect on differences between the sample sets.
ProfilerTM AM+ permits principle component analysis (PCA) and clustering analysis by comparing sets and is ideal for searching for components (biomarker candidates) exhibiting characteristic changes from large volumes of data.
See MetIDSolution Metabolite Structural Analysis Software for the high-throughput and comprehensive detection and identification of metabolites.
Profiling Solution

Metabolomic methods to detect differences in the complex data files obtained from an extremely large number of samples or compounds provide a powerful tool for both academic research and applied fields, including pharmaceuticals, foods, and the environment, by clarifying metabolic pathways and control mechanisms.


